


In his new Capital in the 21st century, as forbidding as his previous work on High Wages in France in the 20th century, Thomas Piketty presents a mass of data on asset growth in several European countries and the United States. This information improves the knowledge of our society’s relationship to capital and the divide between the richest and the poorest. Except that the author abuses these data, following 19th century scientific materialism.
Like Marxist authors, he endeavours to transform his discourse into a scientific demonstration. He wants not only to convince, but to hit home his own truth, supposedly grounded in the mathematical formula that he presents. Granted, he states that “we should be wary of any economic determinism in this matter” (p. 47), but he uses econometrics to announce the expected wealth distribution in the 21st century, as if there were little or no risk of making mistakes.
And his claim is that the divide between rich and poor will inevitably widen, although he admits that the opposite took place during the 20th century. He extrapolates trends, as did Malthus in the 18th century or the Rome Club in the 1970s to predict that the world would die of starvation. He questions Kuznets’s inequality bell curve, sketching trends that ignore human action. He notes that “Marx totally ignored the possibility of technical progress and continuous productivity growth” (p. 28) in his theory of infinite capital accumulation killing off capitalism, but on the other hand he reproduces a theory of constant wealth growth.
Abstract:
– Thomas Piketty presents statistical graphs in the manner of Malthus in the 19th century or the Rome Club in the 1970s
– Piketty’s theory of boundless wealth accumulation does not withstand factual analysis
– There is first confusion between capital (productive, financial and real estate) and negotiable assets
– Thomas Piketty claims that for the past 20 centuries, the asset rate of return is 4 percentage points above the rate of economic growth
– But how could he possibly obtain such data for the past 2,000 years? This is absolutely impossible
– Further, and contrary to what he claims, the average asset rate of return of households cannot be higher than the rate of economic growth
– If Piketty’s calculations were accurate, then the wealthiest 1 per cent would own all available assets by 2016!
– Piketty’s calculations are wrong because he ignores reality: the economy is not a zero sum game, capital is saved, reinvested or even wasted; social mobility is extremely important and inequalities are not set in stone
1) The infinite growth of large fortunes or the limits of mathematics
The postulate is that the inevitable growing wealth disparity is due to a fundamental inequality as expressed in y > g where y is the capital yield (i.e. the average yield in a year in the form of profits, dividends, interests and rent … as a percentage of its value) and g represents the rate of economic growth (i.e. the annual increase of income and production). Piketty starts from the fact that growth in the past two thousand years was always less than 1 per cent, or even 0.2 to 0.5 per cent before the 19th century, except in the 20th century when it was substantially higher, whereas during this entire period the capital yield was at 4-5 per cent before taxes, noting that there was practically no wealth taxation before the 20th century.
“When the rate of return on capital is significantly higher than the rate of growth – and we shall see that this was almost always the case throughout History, at least until the 19th century and it is likely to become the norm again in the 21st century – this mechanically implies that wealth inherited from the past is recapitalized faster than the rate at which production and incomes increase. Thus it is enough for the heirs to save a small share of their yield in order to make their capital grow faster than the economy as a whole. Under these conditions, it is almost inevitable that … capital concentration will reach extremely high levels …” (p. 55)
He thus reckons that the hyper-concentration of wealth observed in traditional and agrarian societies, especially until World War I in Europe, “is linked to the fact that these are low-growth economies with a capital yield that is clearly and durably higher than the rate of growth … Consider a world with low growth, for instance somewhere around 0.5-1 per cent per annum, as was the case until the 18th and 19th centuries. The pre-tax capital yield, which as we have seen was generally some 4-5 per cent per year, is by design much higher than the rate of growth in such societies. Basically, this means that inherited wealth is recapitalized much faster than the rate of economic growth, including without any labour income. For instance, if g = 1 per cent and y = 5 per cent, then it is enough to save a fifth of the capital yield … for a capital inherited from the previous generation to grow at the same rate as the overall economy” (p. 558). And obviously, in this scenario by saving more than 1 per cent, the capital will have a tendency to increase rapidly.
+The mathematical boomerang+
But the mathematical formula employed by Piketty as a magic wand of economic and social history seems to be incoherent when applied over time. The new prophet of advanced socialism seriously claims that the rate of return of capital was 4 to 5 percentage points above economic growth for the past 2,000 years. If this were the case, how would capital have accumulated sustainably at a higher level than what the rate of economic growth allowed? For wealth may not be seized by the richest, as Thomas Piketty believes, beyond the limits of existing wealth whose growth more or less reflects the general rate of growth. If during the past 2,000 years wealth increased by 4 per cent a year on average whereas the rate of growth oscillated below 0.5 per cent, it would quickly have shown that the existing wealth was insufficient to satisfy the demand for increased wealth which savings would have required in placement. Or the rate of return would at least have decreased much faster than Piketty imagines. To clarify, his formula and the long and the short of his pseudo-demonstration cannot apply over time.
True, he admits that
“if asset holders globally increase their wealth faster than the average income, then the capital/income ratio will tend to rise without limits, which in the long term should entail decreasing rates of return … In principle, this process always stops eventually (when foreign asset holders end up owning the entire planet) but this obviously takes some time. This explains to a large extent the seemingly limitless increase of the higher centiles of the British and French hierarchy of fortunes during the Belle Epoque” (p. 573).
Since he is intelligent he raises the possible objection, but since he is also an ideologue, he does not take it into account to develop his thinking and calculations.
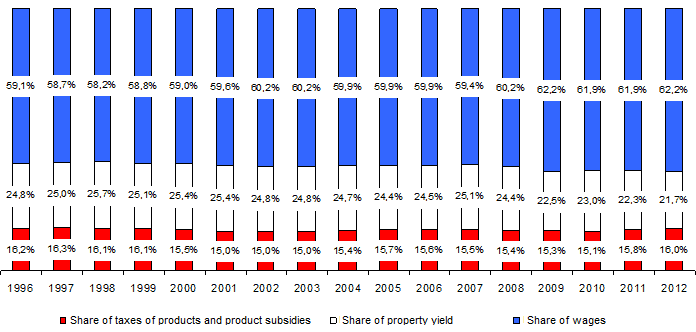
Piketty estimates that the capital yield oscillates in the long term around 4-5 per cent, or even 3-6 per cent with a small decrease to 4-5 per cent through the 18-19th centuries to 3-4 per cent in the 20th century. He also notes that the share of capital in the national income varies in the long term between 25 and 40 per cent, whereas the difference (75-60 per cent) represents the share of labour. This difference is obviously very substantial and would tend to favour labour: “We can see that both in the United Kingdom and in France the share of capital was 35-40 per cent of national income in the late 18th century and in the 19th century, falling to some 20-25 per cent in the mid-20th century and early 21st century” (p. 316). Over the same period, the share of capital in the national income seems to fluctuate between 4 and 5, falling to less than 3 in the 1950s as two World Wars exhausted the capital stock and labour increased in importance as the post-war boom got underway.
Piketty admits that “the total value of the capital stock, measured by years of national income – the ratio measuring the global importance of capital in the economy and society – does not seem to have really changed in the very long run. In the United Kingdom as in France … the national capital represents some five to six years of national income in the early 2010s, i.e. barely lower than the level observed in the 18th and 19th centuries and until World War I” (p. 259). Therefore, by considering that generally the capital stock remains in the same proportion – more or less five – to the national income and considering that the wealth of a nation, or of the world, cannot in the long run exceed GDP growth, we have to admit that Piketty’s formula does not work. For if the rate of return was durably 4 to 5 points higher than the rate of growth, this would mean that by saving just 1 per cent per year of the 4 or 5 per cent yield, the wealthiest would soon run out of investments for their capital.
If a capital of 100 is invested at 1 per cent, a hundred years later this will have increased from 100 to 270,48 and after two hundred years from 100 to 731,60. However, it is more than likely that the wealthiest people, who according to Piketty hold most assets, do not consume all their income, for in order to get richer they must save and continue to do so. And if they saved but a fifth of their yield, they would multiply their assets by seven in 200 years, which would not be possible if this group of the wealthiest people already owned, as he claims, half of all assets.
+The limits of the argument+
The limits of the argument may be demonstrated in another way. Let us start with the situation in 2012: the gross yield is 2.81 per cent, consumption of fixed assets is 0.5 per cent and GDP growth stands at 1.54 per cent.
What portion of my yield should I reinvest to keep my share of income and assets in the GDP with a capital-output ratio that remains constant?
A constant capital-output ratio assumes that the rate of return is equal to GDP growth, i.e. g times the rate. My yield (K) is r.K where r is the rate of return. Therefore x the share of my yield (r.K) which I must reinvest and d the rate of fixed assets consumption. The equation is then
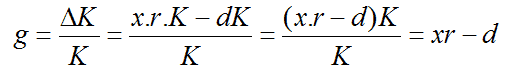
And therefore:
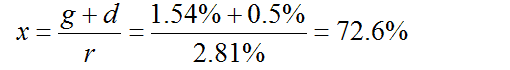
I thus would need to reinvest more than 70 per cent of my return to keep my share of wealth in the national economy. Considering that 2.81 per cent of the average return is taxed, this income is reduced by at least 15.5 per cent. Therefore I have to reinvest close to 86 per cent of my capital yield. Assuming that my marginal tax rate is higher than 15 per cent, I will not be able to keep my share of capital, nor increase it obviously.
Be that as it may, and let us assume that my yield figures are erroneous and take those of Mr. Piketty (1 per cent growth, net yield 5 per cent) and suppose that the wealthiest 1 per cent who own 17 per cent of assets decide to grab all available assets by reinvesting 100 per cent of their wealth. With a constant capital-output ratio, the ambition of the richest 1 per cent will stop in 2016, unless they are able to convince the other 99 per cent to sell their assets. Starting from this date, the desires of the 1 per cent run into the absence of available assets that are necessary to produce growth.
| Year | Investment of the 99% in percentage of capital yield | Investment of the 1% in percentage of capital yield | Share of capital of the 99% | Share of capital of the 1% |
|---|---|---|---|---|
| 2012 | 3,61% | 100% | 83% | 17% |
| 2013 | 2,83% | 100% | 82,3% | 17,7% |
| 2014 | 1,99% | 100% | 81,6% | 18,4% |
| 2015 | 1,11% | 100% | 80,9% | 19,1% |
| 2016 | 0,18% | 100% | 80,1% | 19,9% |
| 2017 | -0,81% | 100% | 79,4% | 20,6% |
The situation presented above may seem outrageous. Taking into account taxes and contributions, let us assume that the 1 per cent may only invest 70 per cent of the yield.
| Year | Investment of the 99% in percentage of capital yield | Investment of the 1% in percentage of capital yield | Share of capital of the 99% | Share of capital of the 1% |
|---|---|---|---|---|
| 2012 | 9,76% | 70% | 83% | 17% |
| 2013 | 9,45% | 70% | 82,6% | 17,4% |
| 2014 | 9,13% | 70% | 82,1% | 17,9% |
| 2015 | 8,81% | 70% | 81,7% | 18,3% |
| 2016 | 8,46% | 70% | 81,3% | 18,7% |
| 2017 | 8,11% | 70% | 80,8% | 19,2% |
| 2018 | 7,74% | 70% | 80,3% | 19,7% |
| 2019 | 7,36% | 70% | 79,8% | 20,2% |
| 2020 | 6,97% | 70% | 79,3% | 20,7% |
| 2021 | 6,56% | 70% | 78,8% | 21,2% |
| 2022 | 6,14% | 70% | 78,3% | 21,7% |
| 2023 | 5,69% | 70% | 77,8% | 22,2% |
| 2024 | 5,24% | 70% | 77,2% | 22,8% |
| 2025 | 4,76% | 70% | 76,6% | 23,4% |
| 2026 | 4,26% | 70% | 76,1% | 23,9% |
| 2027 | 3,75% | 70% | 75,5% | 24,5% |
| 2028 | 3,21% | 70% | 74,9% | 25,1% |
| 2029 | 2,65% | 70% | 74,2% | 25,8% |
| 2030 | 2,07% | 70% | 73,6% | 26,4% |
| 2031 | 1,46% | 70% | 72,9% | 27,1% |
| 2032 | 0,82% | 70% | 72,3% | 27,7% |
| 2033 | 0,16% | 70% | 71,6% | 28,4% |
| 2034 | -0,53% | 70% | 70,9% | 29,1% |
This only means that the term is postponed until 2034 and that from 2013 the 99 per cent of households accept to reduce their investments each year. With a rate of return at 5 per cent, it is hard to see why they would do so.
It is only if the capital-output ratio were to increase that share of the former could increase without forcing the others, but in that case the yield would decrease and capital accumulation would slow down, with decreasing opportunities. Unless the share of profits increases, which would be contrary to the trend documented since 1996, as shown by the following table, calculated in percentage of net added value of the national economy:
2) Swing-wing yield and growth
The issue is then to ask why these calculations seem incoherent. Where is the rub? The answer is that obviously the data set used is confused and swing-wing.
+Confusing the data+
Calculating the capital yield for a nation is no simple matter. Piketty defines capital as: “… the global non-human assets which may be owned and exchanged on the market” (p. 82). There is thus a deliberate confusion between capital (productive, financial and real estate) and negotiable assets.
The yield is calculated in relation to national income (GDP – fixed capital consumption + net revenues from the rest of the world) as a share of privately held assets (households + non-profit institutions catering to households) net of debt. The national income is supposed to be divided between rewarding labour and capital. The capital yield is thus the ratio of national income allocated to the profits from private capital. This share is estimated from business accounts and not derived from all sectors.
The choices made for calculating the yield are arguable and lead to exaggerating the yield. In order to discuss asset inequalities among people you have to focus on the household accounts.
According to Insee:
“Household revenue primarily consists of wages, property revenues (interest, dividends, real estate income …) commercial revenues and social benefits. The balance of household operational budgets for those who own individual businesses is called “mixed income”: it is so called because it corresponds without distinction to the remuneration of the individual entrepreneur and that of his working capital. Similarly, when households produce goods and services for their own consumption (except housing) they derive a “mixed income” that compensates the labour and fixed capital. Further, the operational balance of households producing housing services amounts to the gross operational surplus which corresponds to the sole remuneration of real estate capital.”
Calculating the gross income of households from assets therefore amounts to adding up the gross operating margin and property income. The asset yield is then the gross income minus interest payments divided by the assets of households net of debt.
As an illustration we calculated the household property yield from 1996 to 2012 according to the above method, and then compared with GDP growth rates, the property rate of return net of debt of the nation and to Piketty’s results.
As we can see, this is far from the announced 5 per cent. Since 1996 on average the net nominal property yield of households is 0.4 per cent above the growth rate in current prices (3.58 per cent versus 3.18 per cent). This should not be surprising, for the convergence between the rate of growth and the capital yield is the very basis of economic theory on balanced growth.
Graph 2: Yields and growth:
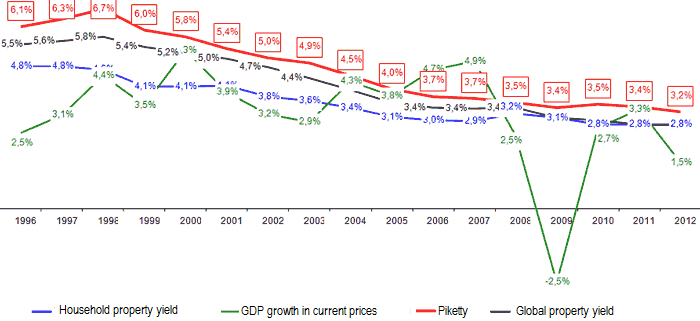
Moreover, all the yield curves are decreasing over the period, which does not appear in Piketty’s tables as he reasons from 10-year averages, and in the period 2000-2010 the average rate according to his calculations is 4.3 per cent, a figure that he maintains for predicting the rest of the 21st century. This supposed constant is not without significance since it implies that the capital-output ratio also remains unchanged.
+Different approaches to growth+
In his book as well as in his scientific paper “Capital is Back” (Piketty & Zucman, 2013) Thomas Piketty analyses the development of the share of capital and its yield in the national income of several countries. He specifies that the national income includes land, real estate and domestic goods revenues and the net revenue from abroad. This definition is certainly more accurate than GDP but also different, for it incorporates elements of GNP and GDP.
Further, in all tables presented by T. Piketty the development of national income is expressed in current prices and not by volume or constant prices. This is not erroneous as such, but it boosts the growth rates of the national income and thus of all variables linked to it. Indeed, the growth rate of the UK national income was 6.32 per cent in 2002 whereas its GDP growth was but 2.2 per cent. Similarly, France experienced negative GDP growth in 2008, but its national income increased by 1.85 per cent.
Graph 3: National income growth vs. GDP growth
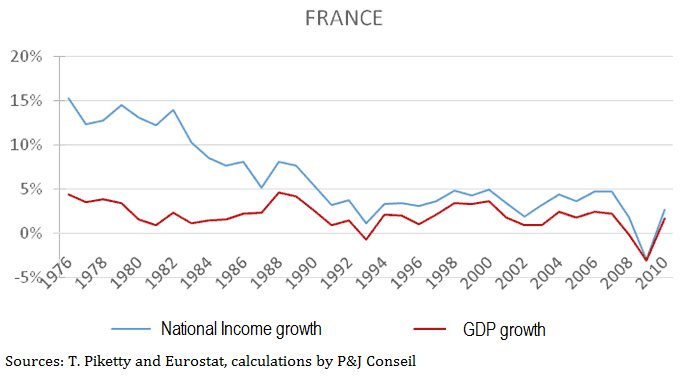
The national income in current prices thus experiences more important variations than the GDP growth rate in volume, as presented by statistical institutes and by T. Piketty himself. However, Piketty calculates the capital yield based on national revenue in current prices. In order to do this, he estimates that the capital stock of a given country as a percentage of the national income. He then evaluates the capital yields as a percentage of the national income and then relates it to the national capital to calculate the yield:
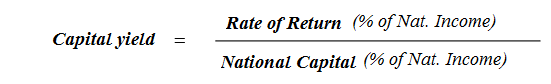
The outcome of such a calculation is that the wealth in terms of capital and its yield are also estimated in current prices, which means exaggerated growth rates. This would not be a methodological problem if T. Piketty compared the capital yield with the growth of national income, but unfortunately when it comes to a definitive comparison of the two rates (y and g)) he chooses GDP and not the national income. Although he does not say so explicitly, this is what comes out of his statistical tables where we may observe that the national income in France grows by an average rate of 6.23 per cent, whereas T. Piketty mentions an average growth of 2 per cent for France, which corresponds to GDP and not to the national income.
Thus it is clear that T. Piketty compares two rates (y and g) that he defines using different methods (the first in current prices and therefore higher, and the latter in volume) and with different measures (the first taking into account foreign wealth, and the second only domestic wealth). According to the data given by T. Piketty, capital yields in France and in the United Kingdom would be some 6 per cent in the period 1975-2010 and 7 per cent for Germany. Had he compared these figures to the growth rates of national income over the same period, he would have concluded that capital yields (y) were below the growth rate (g) in France (y= 5.95 per cent and g= 6.27 per cent), almost equivalent to the United Kingdom (y=5.75 per cent and g=5.13 per cent) and widely superior in Germany (y=7.62 per cent and g=3.3 per cent. Thus T. Piketty would not have been able to draw any general conclusion.
However, by comparing the yields to GDP growth rates, T. Piketty observes that the latter are always lower: GDP increases respectively by 2 per cent, 2.4 per cent and 1.3 per cent over the period 1975-2010 in France, the United Kingdom and in Germany. But as explained previously, this is a mechanical observation since the indexes and calculations are different.
3) Economics is but a humane science
The fact is also and maybe foremost that our false prophet ignores reality. He simply forgets that economics remains a humane science, based on the analysis of changing individual behaviour and human reactions that are sometimes unexpected and reveal their fragility. Economics is also a social science, reflecting the state of society and announcing its developments. But he neglects the human elements that include surprise, creation, innovation and distortion, preferring models based on the past and trends extrapolated from the present.
1. Piketty reckons that wage mobility has been weak (p. 473) while admitting obviously the appearance of a middle class that has replaced the rentiers. Indeed, he notes that “the share of the upper decile in the national wealth in the 20th century occurred entirely for the benefit of the 40 per cent in the middle, and that the share of the 50 per cent poorest has barely evolved”. Thus, there is today a middle class owning about a third of the national wealth. But the stratification in deciles from the poorest to the wealthiest ignores the central phenomenon that deciles are porous. He does not analyse the transfer from one to the other as social mobility occurs in both directions. Yet this social mobility is an important factor, especially in advanced societies and in particular in the United States. First, there is a movement between deciles depending on age, as young people are generally poorer but capable of climbing the social ladder given time. This observation also holds between generations. Ron Askin has shown that today two thirds of Americans enjoy higher incomes than did their parents at their age (Stephen Moore, Who is the fairest of them all, Encounter Books, 2012, p. 50). The Dallas Federal Reserve has published a study covering the period 1975-1991 showing that 98 per cent of poor households in 1975 no longer were poor in 1991 (idem, p. 48).
2. To Piketty, wage inequalities which had decreased substantially in 1950 are once more enormous “because the American and British societies have become much more tolerant of extreme salaries starting in the period 1970-1980 “(p. 528). In a way, executives in large industrial and commercial organizations have ended up setting their own salaries. This is probably true in part, but it is also a fact that the technological and managerial revolution starting in the 1970s led large corporations to make huge profits when they were well managed, and the management sought to appropriate a part of these profits, which is legitimate.
3. He uses yields before tax and includes capital losses linked to warfare. After tax, he admits that capital yields have been below growth in the period 1913-2012. Nevertheless, he concludes that the wealth gap will widen in the 21st century for reasons that are germane to ideological speculation.
4. Piketty does not include the wealth represented by pay-go pension systems, although this would doubtless re-balance the gap. Worse, he condemns outright pensions through capitalisation, but at the same time he stresses the importance of yields for great fortunes. Curiously, while raving against scandalous, excessive and almost guaranteed capital yields to private fortunes, when it comes to the potential return of pension funds, he admits that “the capital yield is in practice extremely volatile” and that “it would be foolhardy to invest pension contributions of a country in the world financial markets”! (p. 784). This is the height of paradox: he rejects easy money because it favours capital owners but the same capital miraculously becomes a problem for pension funds.
5. In particular, he ignores what seems essential, namely the skills required to successfully manage capital, which are probably more important today than before. Some people prefer not to take any risks, putting their money in government bonds or savings accounts, and at current interest rates they are losing money. Others invest in new companies without judgment, and lose their capital. And finally there are those with the business acumen and ability of some captains of industry and financiers. And concerning the importance that should be granted to this ability, we should take into account the multiplier which is the increased life expectancy, enabling those who have this gift to accumulate wealth for a longer time, as wealth brings more wealth.
Yet there are also breaks from one generation to the next. Fortunately perhaps, sons are not always as gifted as their fathers. The heirs are often spenders and capable of dilapidating very quickly what previous generations have accumulated. As the saying goes, in the best of cases the grandchildren go into the arts, and in the worst they go to the dogs. In both cases, the money is lost, with some exceptions. Certainly Piketty admits that there are “shocks in the family lineage, making it possible to avoid an infinite growth of inequalities on the individual level and to converge towards a balanced wealth distribution”, for it often happens that a prodigal son wastes his inheritance (p. 72). But Piketty does not include this in his model, although this phenomenon is a significant factor of wealth development.
This also ignores the fact that fortunes sometimes – even often – are lost by those who created them. On 31 October 2013, the newspapers announced the fall of Brazilian magnate Eike Batista who still in 2012 ranked number 7 on the Forbes list of the world’s wealthiest people. He will most likely lose everything unless he can repay his debts, including his company Huis-Clos, founded by René Bertin in the 1990s after having sold the company Feu Vert. But you cannot win them all, not every time!
Piketty pronounces his magic formulas in order to reach the conclusion he seeks: we need a global progressive capital tax, taking 10 per cent annually off the greatest fortunes to avoid this infinite wealth accumulation seen as inevitable, although he has in now way proven this is the case. If the premises are wrong, the conclusion is forcibly false. His single objective is to “put an end to ever-increasing high salaries” (p. 830). This is why he wants a progressive income tax with an optimal highest rate at 80 per cent. In addition, he would like to see an inheritance tax with equally confiscatory rates. And this system should of course be implemented on a global scale, so as everybody is controlled and nobody escapes Big Brother. In this way he wants to avoid “the risk of an unlimited progression of the share of large fortunes in the world”, the danger of which to him seems very high (p. 842). His objective is to control, to make government, and governments to become the master of all. To him, “a progressive tax on individual wealth is an institution which enables the general interest to gain control over capitalism” (p. 867).
+From false premises to fallacious conclusions+
If science is but an alibi for politics it cannot be sincere, objective or serious. In his book on High incomes in France in the 20th century, he noted that “throughout the century an ‘invisible hand’ seems to have made sure that “the difference between wages in the lower and upper deciles keep their distance to the average wage” (pp. 223-224). But he does not seem to wonder about the nature of this invisible hand that is but the product of human balances, ensuring that the trees do not reach the sky. He disregards his own observations since they disturb his conclusion.
+A different perspective+
Market economies have enabled the majority to become wealthier. Yesterday’s world was no less harsh on poor people who were not less numerous. It is said that Rome at the end of the Empire supported 120,000 indigents. There was massive poverty in the eastern part of the Roman world in the 6th century. During the Middle Ages, the poverty level fluctuated of course, but was generally much worse than today. In Burgundy as told by Michel Mollat, “in Dijon in 1397 the miserable represented 83 per cent; in 1431 and 1433, they were still 58 and 54 per cent, and 27 and 34 per cent of beggars” (Les pauvres au Moyen-Age, Editions Complexe, 1992, p. 283). The Church and the monks took active care of the poor at the time. But it was the liberal revolution and that of industry which in time made it possible to lift a greater number of people out of poverty. This phenomenon is now being repeated on a global scale.
Between 1990 and 2010, the income and wealth gaps increased considerably, as both Piketty and Pope Francis complain in unison. But at the same time, world poverty is retreating. In 1990, 47 per cent of the world population lived on less than a dollar per day. Twenty years later, 22 per cent still share this terrible lot, surviving on less than 1.25 dollars per day (the equivalent of 1 dollar in 1990). This means that 700 million people have been lifted out of extreme poverty. A study conducted by seven researchers, including from the World Bank, shows that the number of Latin Americans living on less than 4 dollars a day has decreased from over 40 per cent in 2000 to less than 30 per cent in 2010. In Latin America today, the poor are equal in number to the middle class, whereas they were two and half times as many just a decade ago.
This is not to deny the wealth gap or how it is evolving. In this respect, Piketty’s data are useful and interesting. But the issue is ill put as it is politicized and becomes a vehicle for an egalitarian obsession that has nothing to do with economics. Granted, too large gaps in incomes and wealth may destabilize society, create tensions and misunderstandings that sometimes lead to uproar. Yes, the wealth of some may be unbearable, conceited and arrogant. But the question is less about if such gaps are morally justified, even if this may be relevant, than about reflecting on the impact of such gaps and their influence on economic and social conditions.
History shows that in free societies where the rule of law is respected, wealth gaps do not increase infinitely, but contribute to greater growth for the benefit of all:
– Where competition works in a transparent and spontaneous way, companies will only develop under the pressure of market forces and within the limits of the prices offered by competitors. In France, Free entered the mobile phone market and pushed down the prices of all its rivals … and their profits … for the benefit of consumers.
– Where financial markets are complex and constantly evolving, incapable rent-seekers quickly disappear. Even investing in government bonds is dangerous today, and being a successful investor requires attention and perspicacity.
– Where government is not propping up dying companies or establishing useless and costly privileges, only those who create products and services bought freely by consumers will prosper.
– Where there are no undue safety nets for slackers and other profiteers, those who will not work will not eat, as St. Paul said.
It is elsewhere, in collectivized societies, where the bureaucracy has taken hold of wealth, that the latter accumulates for those who stamp permits, whose incongruous authorization is needed and paid for. It also accumulates in satellite states, supported by some governments that funnel billions collected through local authorities, as vain as they are servile.
Yes, Piketty is right to think that too wide or unjustified gaps engender misunderstandings, uproars and social strife. But when wealth is produced through hard work, innovation, services offered on a free market, and when accumulated capital cannot survive those who produce it or keep it in the general interest, wealth is less likely to spark a revolution. Wealth and income gaps are intolerable where they result from perverse, mafia-like or collectivist political regimes. As noted by Jia Zhangke, director of the movie “A touch of sin”: “The worst problem in China today is not that it is a class system, but the fact that there is no way of moving from one class to another. The rich join forces with those in power by corrupting them, which lets them control resources and obtain political clout in their turn. This is what makes people angry.”
Where you are free to develop, to change position or social class, climbing the income and property ladder, disparities are easier to bear; sometimes it is even borne well because it makes it possible to observe what each is capable of through her own efforts, tenacity and work … as has been stated most scientifically by Michel Forsé, Olivier Galland, Caroline Guibet Lafaye and Maxime Parodi in their work with a preface by Raymond Boudon, “L’Egalité, une passion française?” (Armand Colin, 2013).
The market is not responsible for bad human behaviour. On the contrary, it is the system that best directs human action in the best manner, however imperfectly. As Churchill said about democracy, the free market is doubtless the worst system, except for all those other forms that have been tried from time to time. As imperfect as it is and despite all the risks entailed, the market economy rests on individual responsibility and therefore on the respect of each in her dignity as a human being, capable of finding her own way, regardless of where she starts.
Too much assistance leads to a new form of slavery, soft yet tyrannical, and to the loss of any self-worth. It is up to the wealthiest and brightest to realize that they hold greater responsibilities towards their fellow men in a free society. In this respect, the free market is also the lesser evil because it allows those who have succeeded to assume their share of human imperfection (through charity, by participating in the development of new companies) which means that some are less fortunate and incapable of getting out of poverty. “To believe in democracy, said Ludwig von Mises, means first believing in things higher than democracy.” This also applies to the free market.
Jean-Philippe Delsol
President
IREF