


Suppose we had a society where the only difference among its members were their age. How unequally would wealth then be distributed?
Among the chief factors causing wealth inequality are differences in income, inheritance and savings behaviour. But how much inequality would prevail if all members of society were endowed with identical wealth development over time and only differed in age? The answer will depend on what path exactly will the common lifecycle wealth take, but the results can be significant.
France Or Italy More Equal Than Germany
In a recently published study, the German Institute for Economic Research (DIW) points to “persistently high wealth inequality in Germany”.
Inequality can be measured by the Gini coefficient, which takes on values between 0 and 1. The higher the number, the higher the inequality. A Gini of 0 indicates that all wealth is distributed in equal chunks among all members of a society. In a Gini-1 world, on the other hand, one member holds all the wealth.
According to DIW calculations, the Gini coefficient for actual 2012 wealth distribution in Germany is 0.78. This may be lower than the reported figure for the United States (0.87), but is higher than for example France (0.68), Italy (0.61) or Slovakia (0.45).
The DIW study does not, however, consider statutory pension rights or school-acquired human capital as wealth. It has been suggested (for example by the chief online economics editor of the Frankfurter Allgemeine Zeitung here [German]) that this omission overestimates the true wealth inequality in Gemany. In our thought experiment, though, this debate is not essential since we are considering wealth distribution in a society where all society members enjoy the same wealth over their individual life-cycles.
Inequality Of Wealth Equality Over The Life-Cycle
When they are young, people invest in their education and skillset. At this stage they achieve only low income and wealth. Over the course of working life their wealth grows and is subsequently drawn upon during retirement. So let us start with the value of average personal net wealth in Germany of 83.000 Euro. We’ll further assume that the same number of people are born every year and every person dies on their 85th birthday. On that day, they will have exactly exhausted their wealth.
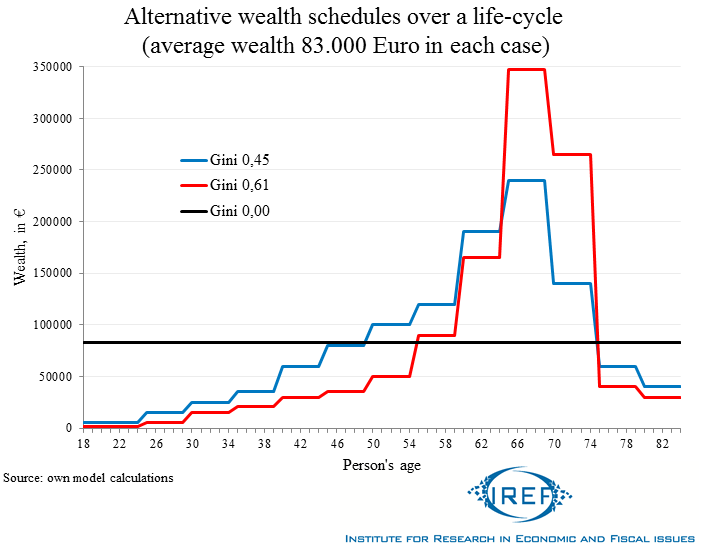
The graph illustrates how Gini coefficients produce relatively significant disparities of wealth over the person’s life although the total average always stays at 83.000 euros. Incidentally, the peaks of the model distributions are picked to correspond to the current real world situation in Germany where the 65-69 year olds possess the greatest net worth.
Is German Degree Of Inequality Due To Age Differences? Not Really.
In order to distribute the average capacity wealth of 83,000 euros according to the Gini of 0.78 measured for 2012 Germany, the curve of wealth distribution would have to have an implausible shape such as the one depicted below:

The group of 65-69 year olds would still enjoy the greatest average wealth, but they would have to accumulate and dissolve it extremely quickly.
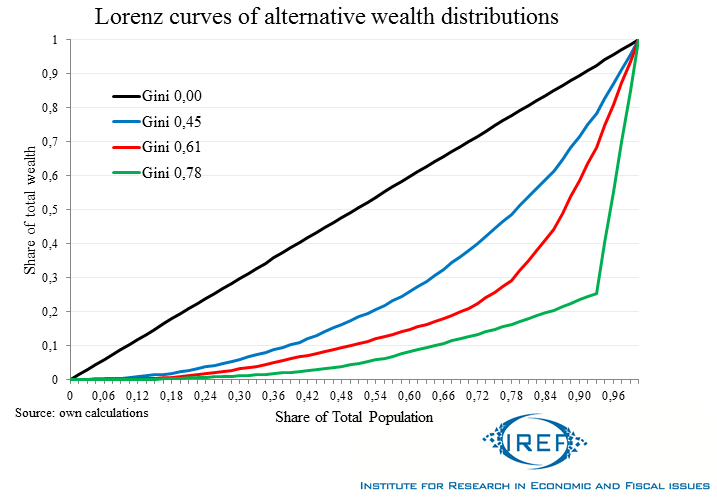
Lorenz Curves: Graphical Representation Of Gini Coefficients
In order to illustrate better the different degrees of inequality, we can employ co-called Lorenz curves. The straight slope on the graph shows the case of a completely equal distribution of assets with a Gini of 0. The other curves represent distributions of wealth that lead to the Ginis measured for Slovakia (0.45), Italy (0.61) and Germany (0.78 )
Comparing Wealth Within Age Cohorts Is More Sensible
DIW’s figures for Germany can only be achieved using unrealistic time frames under the forced assumption of identical development of net worth in all individuals. Nevertheless, the debate about wealth inequality should include consideration of the role played by differences in people’s age. As the four Lorenz curves show, age-related differences in wealth can significantly influence the final measurement of inequality even if everybody in a cohort enjoys the same wealth.
It is not particularly enlightening to compare the wealth of students and job-market entrants with wealth of people approaching or past the end of their careers. Analysis of wealth inequality within cohorts (which would also have to consider pension entitlements) will be needed in the future to aid us in understanding the phenomenon of wealth inequality.