


In order to achieve a satisfactory degree of socio-economic cohesion, the European authorities have long recognized the importance of convergence in per capita levels of Gross Domestic Product (GDP). As the fulfilment of this objective requires that relatively poor regions exhibit per capita GDP growth rates higher than those registered in the richer countries, the EU policy – of which cohesion funds are an important component – has been directed at increasing growth in economically weaker regions.
After the first Eastern enlargement of the EU (2004-2007), interest in the issue of convergence slightly declined. The general feeling was that the Eastern economies would have been able to grow at an acceptable pace on their own, consistent with the so-called “catch-up effect”. Indeed, as Table 1 shows, Eastern and Baltic countries have exhibited an average per capita GDP growth rate well beyond 3% over the period 2010-2016.
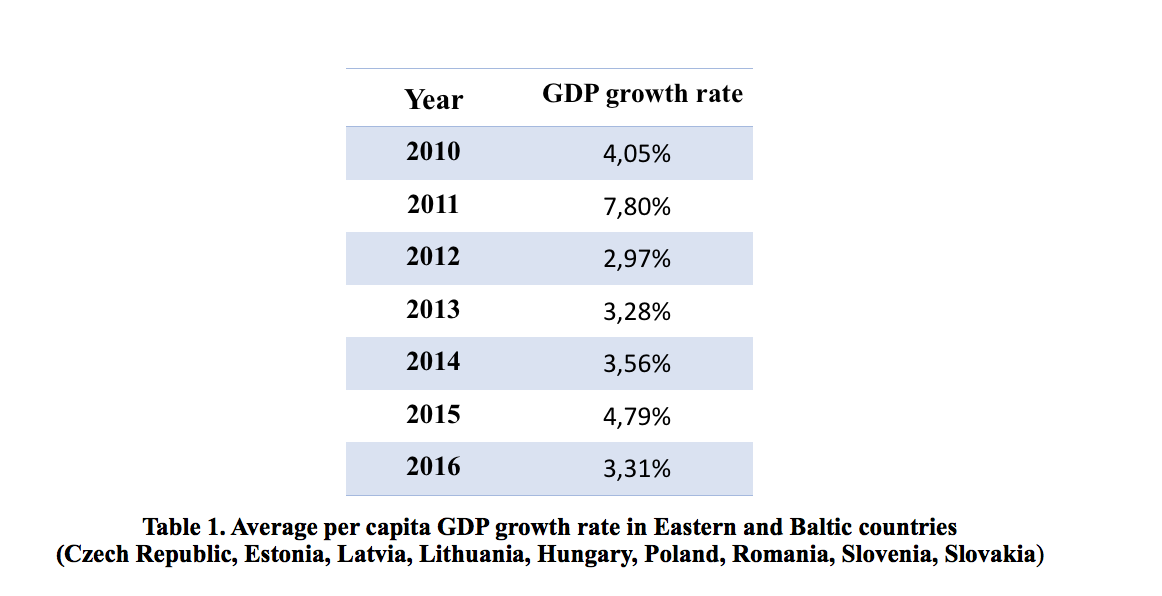
Romania, Poland, the Czech Republic and Hungary are all still growing relatively fast. According to a recent report by the European Commission, expected real GDP growth rate in these countries will be close to 4% both in 2018 and 2019.
Yet, concerns about the situation of some of the EU major countries has made convergence a hot issue again. For example, Italy and Spain suffer from serious problems, and some of their regions have drifted towards relative poverty.
Similar difficulties are also emerging in selected areas of Denmark and Sweden.
In this light, demands for the reallocation of the EU cohesion funds – possibly from the East to the South – have become pressing.
Convergence Among EU Regions in Four Graphs
Let us illustrate these trends by means of four graphs. First a little methodology. The economic literature provides a straightforward way to assess convergence. One assumes that the smaller the capital stock per worker in a given area, the lower the level of GDP per capita, and the more productive investments will be. According to this view, therefore, poorer economies present low levels of capital per worker, but high returns on capital. As investments are attracted by higher returns in poor countries, growth accelerates and the economy catches up with richer countries.
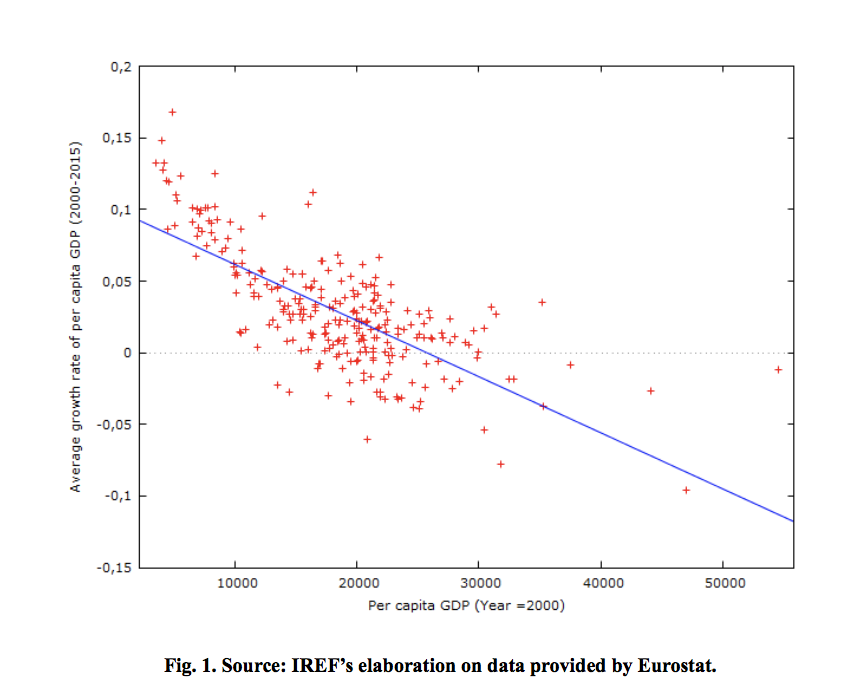
According to this line of reasoning, GDP growth in a given period is negatively correlated with the initial GDP level; therefore, if we focus on the 2000-2015 period, we would expect regions with lower per capita GDP in 2000 to experience higher growth rates. The graph below (Fig. 1) considers GDP per capita in year 2000 (horizontal axis) and growth rates (vertical axis) for 268 European regions (excluding regions belonging to Croatia, because of missing data). Notice that, in order to compensate for price level differences, we use data on GDP expressed in euros corrected for purchasing power parities (PPPs), an artificial currency unit that allows meaningful comparisons.
The figures shown in the graph support the hypothesis of convergence: over the period 2000-2015, poor regions grew faster.
This aggregated evidence hides, however, one important feature. Fig. 2 (panel a) shows the level of per capita GDP in each region (each column in the graph is made of all the 268 regions in the sample) for each year (each column corresponds to a year). A bird’s eye view suggests that from 2009 to 2016, economic growth (on average) went hand in hand with increasing GDP dispersion, i.e. increasing divergence in income levels across regions.
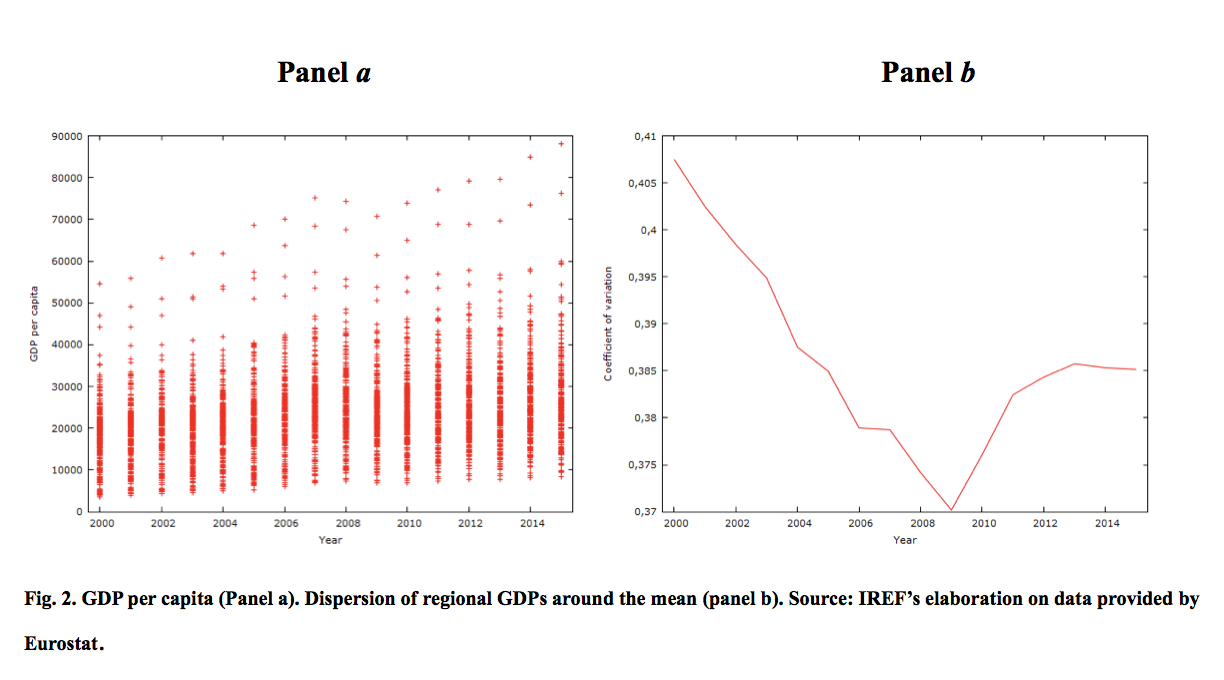
This impression is confirmed by Fig 2 (b), which displays the dispersion of GDP per capita across regions relative to the EU average. Dispersion declined between 2000 and 2009 and then rose significantly as a consequence of the Great Recession triggered by the burst of the US house bubble in 2007 and the EU public debt crisis.
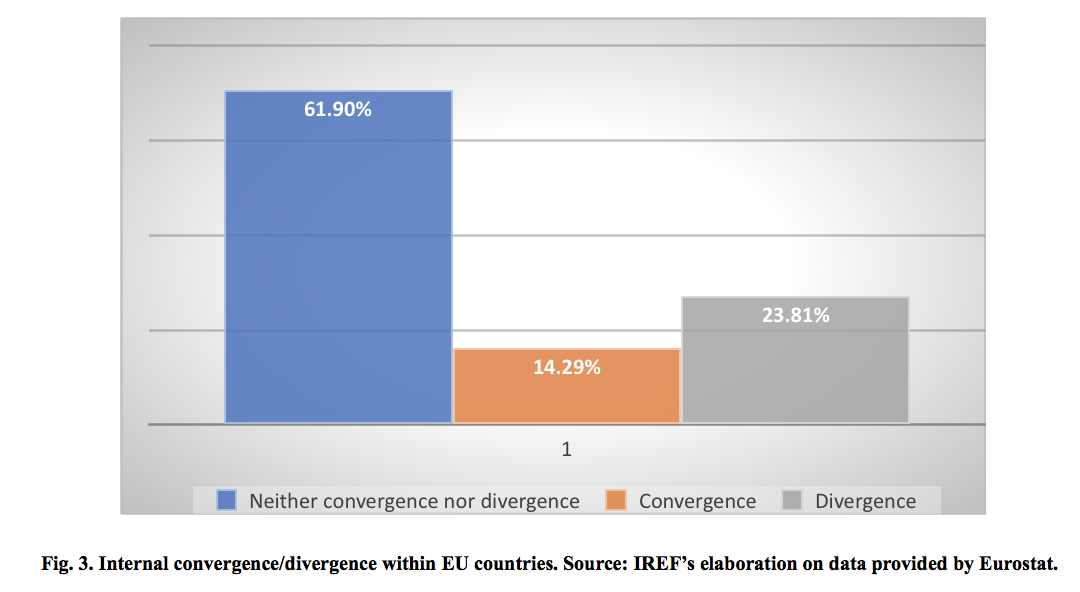
The fourth graph (Fig. 3) shows the portion of EU countries that display internal convergence among regions, divergence or none of them. As the graph shows, during the period 2000-2015 convergence within each country was quite rare and, in one country over four, significant internal divergence took place.
Political Perspectives
In contrast with a popular view that sees the European economy as consisting of a core of homogeneous countries surrounded by a poor periphery, the evidence presents a more complex picture: some regions in economically advanced countries are lagging behind, whereas regions in once peripheral countries have made significant progress. Fig. 4 shows the change of GDP per inhabitant in relation to the EU average over the period 2007-2015. As one can easily see, Eastern regions have made a big jump ahead, whereas many regions in traditionally more advanced countries have lagged behind. These changes will have consequences, primarily in regard to the reallocation of the 350bn of euro involved in the cohesion policy funds. Eastern countries have massively benefited from such funds in recent years (EU budget 2014-2020). As the picture changes, and the cuts due to Brexit (about 10%) are taken into account, tensions might emerge.
For example, recent proposals concerning the post-2020 EU budget imply substantial cuts (about 20%) to the funds allocated to the Eastern countries. By contrast, Western low income countries like Greece, Spain and Italy claim access to a larger share of the pie. Regardless of the outcome, trouble is round the corner.
